From Blueprints to Sprints: Navigating Process and Execution
Part 2 of 3. Exploring how teams move from strategy into process models and sprint commitments, enocoutering misalignment.
Bridging Strategy and Execution
In Part 1 of this series, we explored how the same word means different things at different organizational altitudes. Strategic terms (business case, roadmap) answer “what outcome do we need?” Requirements terms (BRD, user stories) answer “what value do users need?”
This article covers the middle ground: how work flows and what teams actually build.
Phase 3 (Process Modeling) visualizes workflows before automation. Phase 4 (Execution) defines what teams commit to deliver in sprints. This is where strategic intent meets operational reality.
And where translation breakdowns often start to show up.
Phase 3: Process Modeling & Design
BPMN (Business Process Model and Notation)
What it means: Standardized visual language for mapping business processes. Shows sequence flows, decision points, parallel activities, system interactions, and handoffs between actors.
Why it exists: Creates shared process understanding across business and technical stakeholders. Identifies automation opportunities, bottlenecks, integration touchpoints, and exception paths that text-based requirements miss.
How it translates to tech: Before building workflow automation, map the current process, not the imagined ideal. BPMN reveals what’s documented versus what actually happens. Engineers see system touchpoints. Business sees handoffs and decision logic.
Real scenario: Business requests “Automate customer onboarding process.”
Without BPMN, engineering assumes a linear flow: submit form → validate data → create account → send confirmation.
BPMN reveals reality:
- Onboarding touches 7 different systems (CRM, billing, provisioning, support, compliance, analytics, notification service)
- Includes 4 approval steps (credit check, compliance review, capacity verification, manager approval for enterprise)
- Has 3 manual exception paths that occur 40% of the time (missing documentation, credit issues, custom contract terms)
- Involves 5 different roles (sales, finance, ops, legal, support)
- Contains 2 loops where process circles back based on conditions
Suddenly “automation” becomes: complex integration project + exception handling system + change management initiative + training program.
Common failure: Business describes their process verbally. Engineering builds automation based on that description. Go-live reveals the real process includes dozens of undocumented exceptions, informal workarounds, and “we just call Jim when this happens” scenarios. System is technically correct but operationally unusable.
Translation bridge: Map the is before designing the should be. BPMN the current state, including all the messy exceptions. Only then can you identify which parts to automate, which to eliminate, which to keep manual, and which to redesign entirely.
Wireframes / Mockups
What it means: Visual representations of user interfaces. Wireframes show low-fidelity structure and layout. Mockups show high-fidelity styling, branding, and detailed design.
Why it exists: Makes abstract requirements concrete. Surfaces usability issues, stakeholder misalignment, and missing requirements before expensive development starts.
How it translates to tech: Visual artifacts show structure and appearance, not behavior or business logic. Avoid building directly from wireframes without confirming the underlying requirements. The picture shows what users see. Requirements define what the system does.
Real scenario: Designer delivers wireframe showing three-column dashboard layout with revenue chart (left), conversion funnel (center), and recent activity feed (right).
Engineer implements it pixel-perfect. All three widgets appear exactly as wireframe shows.
Product reviews and says, “These widgets don’t update in real-time. I need to see live data.”
Engineer responds, “That wasn’t in the wireframe.”
Both are right. The wireframe showed layout, not behavior.
The requirement “widgets display live data updating every 5 seconds” should have been in:
- The user story: “As a sales manager, I want to monitor team performance in real-time…”
- Acceptance criteria: “Dashboard metrics update automatically every 5 seconds without page refresh”
- TRD: “WebSocket connection maintains live data stream from analytics API”
The wireframe just showed where widgets go.
Common failure: Stakeholders review wireframes and say “looks great, build it.” Team builds exactly what was shown. Stakeholders review working system and say “that’s not what I wanted.” What happened? The wireframe couldn’t show interactive behavior, error states, empty states, loading states, or edge cases. Approving the visual doesn’t mean approving the behavior.
Translation bridge: Wireframes answer “what does it look like?” not “how does it work?” Pair every wireframe review with a walkthrough of user flows, error handling, and state transitions. Static pictures can’t capture dynamic systems.
Phase 4: Execution & Implementation
Sprint Backlog
What it means: Prioritized list of user stories and tasks the team commits to completing in the current sprint (typically 1-2 weeks). Team’s immediate work plan.
Why it exists: Creates focus and commitment. Prevents work-in-progress overload and mid-sprint priority whiplash that destroys productivity and predictability.
How it translates to tech: This is what you’re building now. Not “soon,” not “eventually,” not “when we get to it.” Sprint backlog is the current contract between team and product owner. Everything else is future scope.
Real scenario: Team is three days into two-week sprint. Sprint backlog contains 8 stories totaling 21 points. Team has completed 2 stories (5 points), work is tracking well.
Stakeholder interrupts daily standup: “Quick question. Can we add password reset functionality this sprint? Customers are complaining.”
A response that tends to create trouble: “Sure, we’ll fit it in.”
A response that protects the sprint commitment: “That’s not in the current sprint backlog. We can add it to the product backlog for prioritization. If it’s urgent enough to interrupt this sprint, we’ll need to remove something of equal size from our current commitment. Which story should we drop?”
This isn’t being difficult. It’s protecting team velocity and maintaining predictability.
Why this matters: Teams that accept mid-sprint additions deliver less, not more. Context-switching destroys productivity. Incomplete stories carry over, velocity becomes unpredictable, and planning becomes meaningless because everyone knows commitments are negotiable.
Common failure: Sprint backlog becomes a wish list instead of a commitment. Stories get added whenever stakeholders ask. Nothing gets marked “done” because team is constantly context-switching. Sprint reviews show half-finished work. Velocity data becomes useless because sprint scope keeps changing.
Translation bridge: Sprint backlog is a commitment, not a forecast. Once sprint starts, scope is locked unless team explicitly agrees to a trade (add X, remove Y). Stakeholders can add anything they want to the product backlog. Sprint backlog stays stable.
Definition of Done (DoD)
What it means: Team-wide checklist of quality standards every user story must meet before being marked complete. Examples: code reviewed, tests written and passing, documentation updated, deployed to staging, acceptance criteria verified.
Why it exists: Prevents “90% done” syndrome where features linger in almost-complete state indefinitely. Creates consistent quality expectations across all work.
How it translates to tech: This is how your team defines “shippable.” Different organizations, different teams, even different projects have different standards. Enterprise teams might require security review, accessibility testing, architecture approval, and compliance sign-off. Startups might just require “works in production.”
Real scenario: Engineer marks story “done” in Jira. Product reviews and asks, “Is it deployed to production?”
Engineer: “No, but the code is merged to main branch.”
Product: “Then it’s not done.”
Engineer: “Code is complete. I finished my work.”
This conflict exists because “done” was never defined.
Better approach (Definition of Done for this team):
- Code complete and committed
- Unit tests written and passing (>80% coverage)
- Code review completed and approved
- Integration tests passing
- Deployed to staging environment
- Acceptance criteria verified by product owner
- Documentation updated
- No critical or high-severity bugs
- Merged to main branch
- Production deployment smoke test passed
Now “done” means the same thing to everyone. Story can’t be marked complete until every checkbox is checked.
Common failure: Teams skip defining DoD, or they define it but don’t enforce it. Stories get marked “done” in wildly inconsistent states. Technical debt accumulates. Production issues spike. Trust erodes between engineering and product because “done” is a moving target.
Translation bridge: Define DoD during team formation or project kickoff. Display it visibly (literally, on the wall or digital board). Reference it in every sprint review when stakeholders question why stories aren’t “done” yet. In practice, DoD works best when it’s treated as a stable team standard. If you want to change it, change it intentionally and apply consistently going forward.
Technical Debt
What it means: The implied cost of rework caused by choosing quick, expedient solutions now instead of better approaches that would take longer. Like financial debt: small amounts are acceptable and often strategic. Large amounts are crippling.
Why it exists: Speed-versus-quality tradeoffs are inevitable in software delivery. Technical debt acknowledges this reality and makes the tradeoff explicit and trackable rather than invisible and accumulating.
How it translates to tech: Every “we’ll clean this up later,” every hardcoded value, every skipped test, every copy-pasted code block, every architectural shortcut creates technical debt. Business often doesn’t see this accumulating until velocity drops, outages increase, or simple changes take inexplicably long.
Real scenario: Product pushes for aggressive Q4 deadline to beat competitor launch. Engineering proposes two approaches:
Approach A (fast):
- Ship in 6 weeks
- Skip automated test coverage (manual QA only)
- Hardcode configuration values (no admin UI)
- Use monolithic architecture (simpler deployment)
- Minimal error handling (assume happy path)
Approach B (sustainable):
- Ship in 10 weeks
- 80% automated test coverage
- Configuration UI for non-technical users
- Microservices architecture (scales independently)
- Comprehensive error handling and logging
Team chooses Approach A. Feature ships on time, competitor is indeed beaten to market. Success, right?
Six months later:
- Simple feature changes take 3x longer (brittle codebase)
- Production bugs increased 4x (no test coverage catches regressions)
- Configuration changes require engineering deploys (business can’t self-serve)
- Scaling issues emerge under load (monolithic bottlenecks)
- Debugging production issues takes hours (poor logging)
That’s technical debt materializing. The initial time saved (4 weeks) gets repaid many times over through reduced velocity and increased maintenance burden.
The business perspective: “Why is everything taking so long now? We built the first version in 6 weeks. This is just a small addition.”
The technical reality: The first version was fast because we incurred debt. Now we’re paying interest on that debt with every subsequent change.
Common failure: Technical debt is invisible to business until it’s catastrophic. Engineering mentions it but can’t quantify impact. Business treats it as “engineers wanting to play with new technology” rather than genuine productivity drag. Debt accumulates until the codebase becomes unmaintainable and requires expensive rewrites.
Translation bridge: Make technical debt visible using business language:
- “This architecture decision will save 3 weeks now but will reduce our velocity by ~15% starting next quarter due to increased complexity”
- “We’re currently spending 30% of sprint capacity on bug fixes and maintenance rather than new features. That’s the interest payment on accumulated technical debt”
- “Refactoring this module will take one full sprint but will reduce time-to-market for related features by 40% going forward”
Translate technical costs into business impact: time, money, risk, opportunity cost.
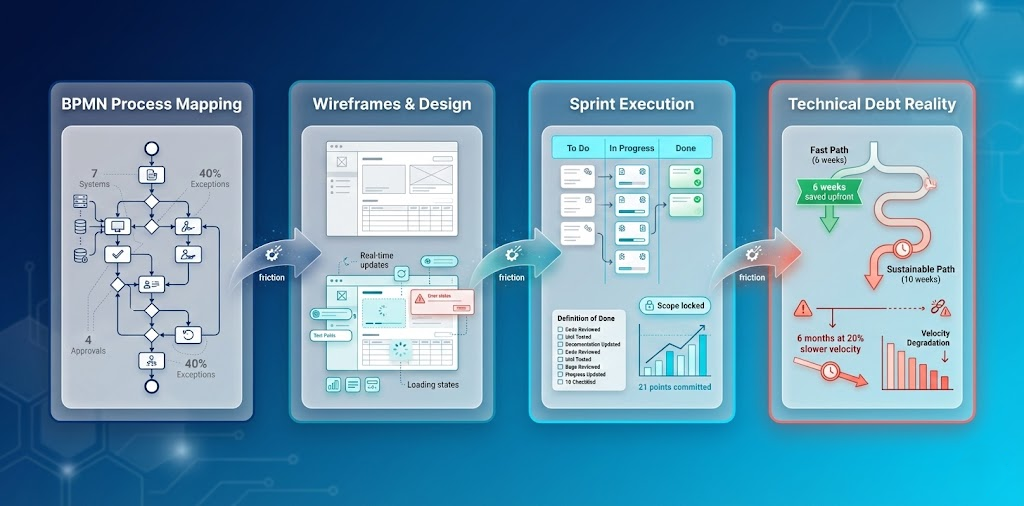 From process mapping to technical debt: The complete execution translation journey visualized
The Execution Translation Gap
Process models show ideal workflows. Wireframes show ideal interfaces. Sprint backlogs show committed work. Definition of Done shows quality standards.
But reality rarely matches the documentation perfectly.
Processes have informal workarounds. Interfaces need interactive behavior specifications. Sprint commitments face pressure to expand. Quality standards get negotiated under deadline pressure.
This gap between documented and actual contributes to many execution failures.
What Makes Execution Translation Work
1. Visual artifacts surface hidden complexity
When business describes a process verbally, create BPMN. When stakeholders approve wireframes, walk through user flows. Visual artifacts reveal what words miss.
2. Sprint commitments are contracts
Once sprint starts, scope is locked. This isn’t rigidity. It’s protecting the team’s ability to deliver predictably. Product can prioritize anything for next sprint. This sprint stays stable.
3. Technical debt must be made visible
Don’t say “we need to refactor.” Say “current architecture is slowing velocity by 20%. Refactoring costs one sprint but accelerates future delivery by 40%.” Translate technical concerns into business impact.
4. Quality standards must be explicit
“Done” means nothing without Definition of Done. Define it. Display it. Enforce it. Change it formally when needed, but never let it become negotiable mid-sprint.
Coming Next
This article covered how work flows (process modeling) and what teams commit to deliver (execution).
Part 3 explores 2026’s emerging terminology. RAG, prompt engineering, LLMOps, vector databases. The new vocabulary reshaping how AI-era teams deliver software. These aren’t just buzzwords. They’re fundamental shifts in how requirements translate to implementation.
The translation problem extends into new territory as AI enters the delivery pipeline.
Read the series:
→ Part 1: When words drift
→ Part 2: Blueprints to Sprints (you are here)
→ Part 3: AI-Era Delivery Terms
Building cross-functional delivery capabilities? Let’s discuss patterns that work in your context.