Supply Chains in the Age of Analytics
Purchase orders are no longer just responses to demand—they're outputs of optimization.
A decade ago, supply chain conversations started with a simple assumption: if demand rises, orders rise; if demand softens, orders slow. Planning was hard, but the relationship between consumer purchases and retailer orders felt reasonably linear.
Today, that line has blurred.
Demand still matters, but it no longer tells the full story. In the modern e-commerce environment, purchase orders are not just responses to demand—they are outputs of optimization.
The Moment It Became Clear
I noticed this shift while working on a supply-chain analytics initiative with a sports equipment brand selling through major online marketplaces. On paper, the retailer’s forecast looked detailed and confident. In reality, purchase orders arrived in their own rhythm: sometimes earlier than expected, sometimes later, often in quantities that seemed to reflect more than consumer demand alone.
The question evolved from “What will customers buy?” to something more nuanced: “Given demand uncertainty, lead times, and costs, how does the retailer decide when to order and how much?”
That shift captures the new normal. E-commerce platforms have built sophisticated systems to predict behavior, allocate inventory, and optimize ordering across thousands of SKUs. Meanwhile, brand suppliers operate with partial visibility—receiving demand signals and forecasts, but not the full ordering logic.
Their challenge isn’t simply forecasting demand. It’s interpreting demand signals to anticipate ordering behavior, then converting that anticipation into procurement, production, and inventory decisions that protect service levels without inflating working capital.
A Shared Reality: Forecasts Are Signals, Not Promises
In marketplace-driven supply chains, the retailer sits closest to the consumer. It sees browsing patterns, search volume, conversion rates, basket behavior, regional purchasing trends, and price elasticity in near real time. It also tracks inventory across fulfillment centers and understands delivery promises and service-level goals.
This enables strong demand forecasts.
Brand suppliers sit closer to production constraints and upstream risk. They manage manufacturing partners, container schedules, lead time variability, minimum order quantities, packaging constraints, supplier reliability, and cost curves. Success is measured not only by keeping retailers “in stock,” but by balancing inventory—too little causes missed sales; too much ties up capital and increases obsolescence risk.
Both sides depend on each other’s signals, but those signals are incomplete:
- Retailers forecast demand, yet optimize ordering in ways that aren’t obvious from the forecast
- Brand suppliers plan production without full transparency into the retailer’s decision engine
The result? A sophisticated coordination problem where the forecast is a demand signal, while the purchase order is a decision—often a cost-optimized one.
This explains why supply chains can look stable from a demand perspective yet feel unpredictable from an ordering perspective. The variability isn’t always because forecasts are “wrong.” Sometimes purchase orders reflect a second layer of intelligence: inventory policy thresholds, freight economics, lead time trade-offs, and risk tolerance.
The Retail Platform Side: Converting Demand Into Decisions
Retail platforms operate at the intersection of customer expectations (“deliver fast, always in stock”) and operational economics (“don’t overstock, don’t waste storage”). Analytics makes that intersection manageable.
Descriptive Analytics: Control Towers
Modern retail supply chains run through dashboards functioning as control towers, tracking:
- Sales velocity by SKU, region, channel, and time window
- Inventory position (on-hand plus inbound pipeline) across nodes
- Weeks of cover (inventory divided by forecasted weekly demand)
- Fill rate, stockout frequency, and lost sales signals
- Inbound reliability by lane, supplier, and lead time band
Descriptive analytics isn’t glamorous, but it’s foundational. Without continuously refreshed views of inventory, demand, and pipeline, downstream forecasting and optimization become disconnected from reality.
Predictive Analytics: Multi-Signal Forecasting
Retail demand forecasting has evolved from relying primarily on historical sales to blending statistical and machine learning methods that incorporate richer signals. Forecasting stacks typically combine:
Time series methods (ARMA/ARIMA, exponential smoothing) capturing trend, seasonality, and autocorrelation
Regression models measuring drivers like price, promotion intensity, and seasonality effects
Machine learning models (gradient boosting, random forests, deep learning) learning complex, nonlinear relationships across features
Demand sensing inputs such as search trends, page views, conversion rates, and promotion calendars
The key isn’t the specific algorithm—it’s the design philosophy. Forecasts are built as systems, not standalone models. A time-series model produces a stable baseline; an ML layer corrects for changing patterns; a business rules layer adjusts around known events like holiday peaks.
Prescriptive Analytics: Ordering as Optimization
Here’s where the modern shift becomes most visible. For many retail platforms, the question isn’t only “How much demand is coming?” but “What is the optimal ordering action given costs and constraints?”
Retailers balance trade-offs:
- Ordering/setup cost (admin overhead, freight, customs, container economics)
- Holding cost (storage fees, capital cost, handling)
- Stockout cost (lost margin, customer dissatisfaction, algorithmic ranking impact)
- Lead time choices (domestic replenishment versus import replenishment)
- Service level targets (acceptable stockout risk)
Classic operations research concepts map naturally onto retail decisions:
Reorder point (ROP) triggers: Order when inventory drops below a threshold covering demand during lead time plus buffer
EOQ logic: Prefer larger batches when setup costs dominate; smaller batches when holding costs dominate
Service levels: Set buffers according to uncertainty and business impact, not just averages
In practice, platforms operationalize these through automated pipelines. Forecasts feed inventory simulations; simulations feed reorder triggers; triggers feed recommended quantities; quantities adjust for constraints like MOQs, carton sizes, shipping capacity, and fulfillment policies.
From outside, this can look like “erratic ordering.” From inside the platform, it’s simply optimization—the order is the chosen solution to a constrained cost-minimization and service-level problem.
The Brand-Supplier Side: Analytics Under Partial Visibility
Brand suppliers must serve retailer performance expectations while managing upstream complexity. Their analytics stack matured for the same reason retailers’ has—uncertainty—but they apply it to different constraints.
The Signal Gap: Planning With Incomplete Data
In marketplace relationships, brand suppliers typically receive:
- Retailer demand forecasts (sometimes with percentiles)
- Limited inventory snapshots at retailer nodes
- Purchase order history (often short and skewed toward high-volume SKUs)
- Lead time and shipping channel constraints
This is useful but doesn’t reveal full decision logic. Because ordering is optimized, historical purchase orders don’t cleanly reflect consumer demand—they reflect the retailer’s economic trade-offs at that time.
Brand suppliers need two predictive lenses:
- Forecasting consumer demand (what will sell)
- Forecasting retailer ordering behavior (what will be ordered and when)
That second lens defines the new normal. It’s not adversarial—it’s realistic.
Predictive Techniques: Layered Approaches
Brand suppliers layer multiple techniques:
Time series forecasting (ARMA/ARIMA): Useful for stable products with consistent seasonality, capturing Q4 surges, summer peaks, or back-to-school cycles
Regression analysis: Identifies drivers behind ordering behavior. Suppliers might model purchase orders as functions of weeks of cover, recent sales velocity, forecast percentiles, lead time band, time-to-peak-season, or price changes
Regression doesn’t just predict—it explains, helping suppliers interpret what “matters” in ordering decisions.
Intermittent demand heuristics: Many SKUs don’t sell smoothly. Some sell in bursts, some have long zero-demand periods, some appear only during specific seasons. Classic time-series models can misbehave. Techniques inspired by Croston’s method or “zero-inflated” logic help by separating “demand size” from “demand frequency.”
In my sports equipment project, demand patterns were explicitly segmented into smooth, intermittent, and erratic categories because one-size-fits-all forecasting wasn’t operationally useful.
Prescriptive Techniques: From Signals to Action
Once suppliers build predictive insight, the challenge becomes decision-making under constraints:
- What should we produce, and when?
- What should we ship through fast domestic versus slower import channels?
- How much safety inventory is economically justified?
- How do we allocate limited capacity across SKUs?
Optimization models become practical:
- EOQ for batch sizing and replenishment cycles
- Linear programming for capacity allocation and procurement planning
- Inventory policy optimization for service-level and cost trade-offs
The objective isn’t simply “meet demand.” It’s “meet demand efficiently while managing risk.” That means balancing customer service with working capital, recognizing that suppliers can be “right” about demand and still struggle if orders arrive in batched, cost-optimized patterns.
Analytics helps suppliers design policies that absorb this behavior: flexible capacity, staged production, and differentiated safety stock strategies by SKU archetype.
Making Uncertainty Actionable Through Simulation
Forecasting is valuable, but simulation turns uncertainty into a planning asset. Supply chains rarely fail due to average demand—they fail due to variance, the weeks when demand exceeds expectations, lead times stretch, and buffers prove insufficient.
Monte Carlo Simulation: The Industry Standard
Monte Carlo simulation is widely used because it’s intuitive and scalable:
- Treat demand as a distribution, not one number
- Sample thousands of plausible futures
- Observe the range of outcomes
- Choose inventory and capacity decisions aligned to risk tolerance
In the sports equipment project, simulation helped translate forecast percentiles into probabilistic ranges, allowing planners to see which weeks carried high volatility and where buffers mattered most.
Other Simulation Approaches
Monte Carlo isn’t the only method. Depending on the problem and available data, organizations also use:
Discrete-event simulation (DES): Models processes like warehouse picking, queueing, port delays, and throughput constraints
System dynamics: Models feedback loops such as the bullwhip effect, backlog accumulation, and policy-driven oscillations
Agent-based simulation: Models interactions among independent actors (multiple suppliers, carriers, retailers making local decisions)
Digital twins: Combines real-time data, simulation, and optimization for continuous scenario testing
The principle is consistent: simulation provides a safe environment to explore “what-if” scenarios before reality forces the outcome.
A Framework That Holds: Descriptive → Predictive → Prescriptive
Analytics has become shared language across retail platforms and brand suppliers because it maps cleanly to how decisions happen:
Descriptive analytics: Where are we today?
Predictive analytics: What is likely to happen next?
Prescriptive analytics: What decision balances cost, service, and risk?
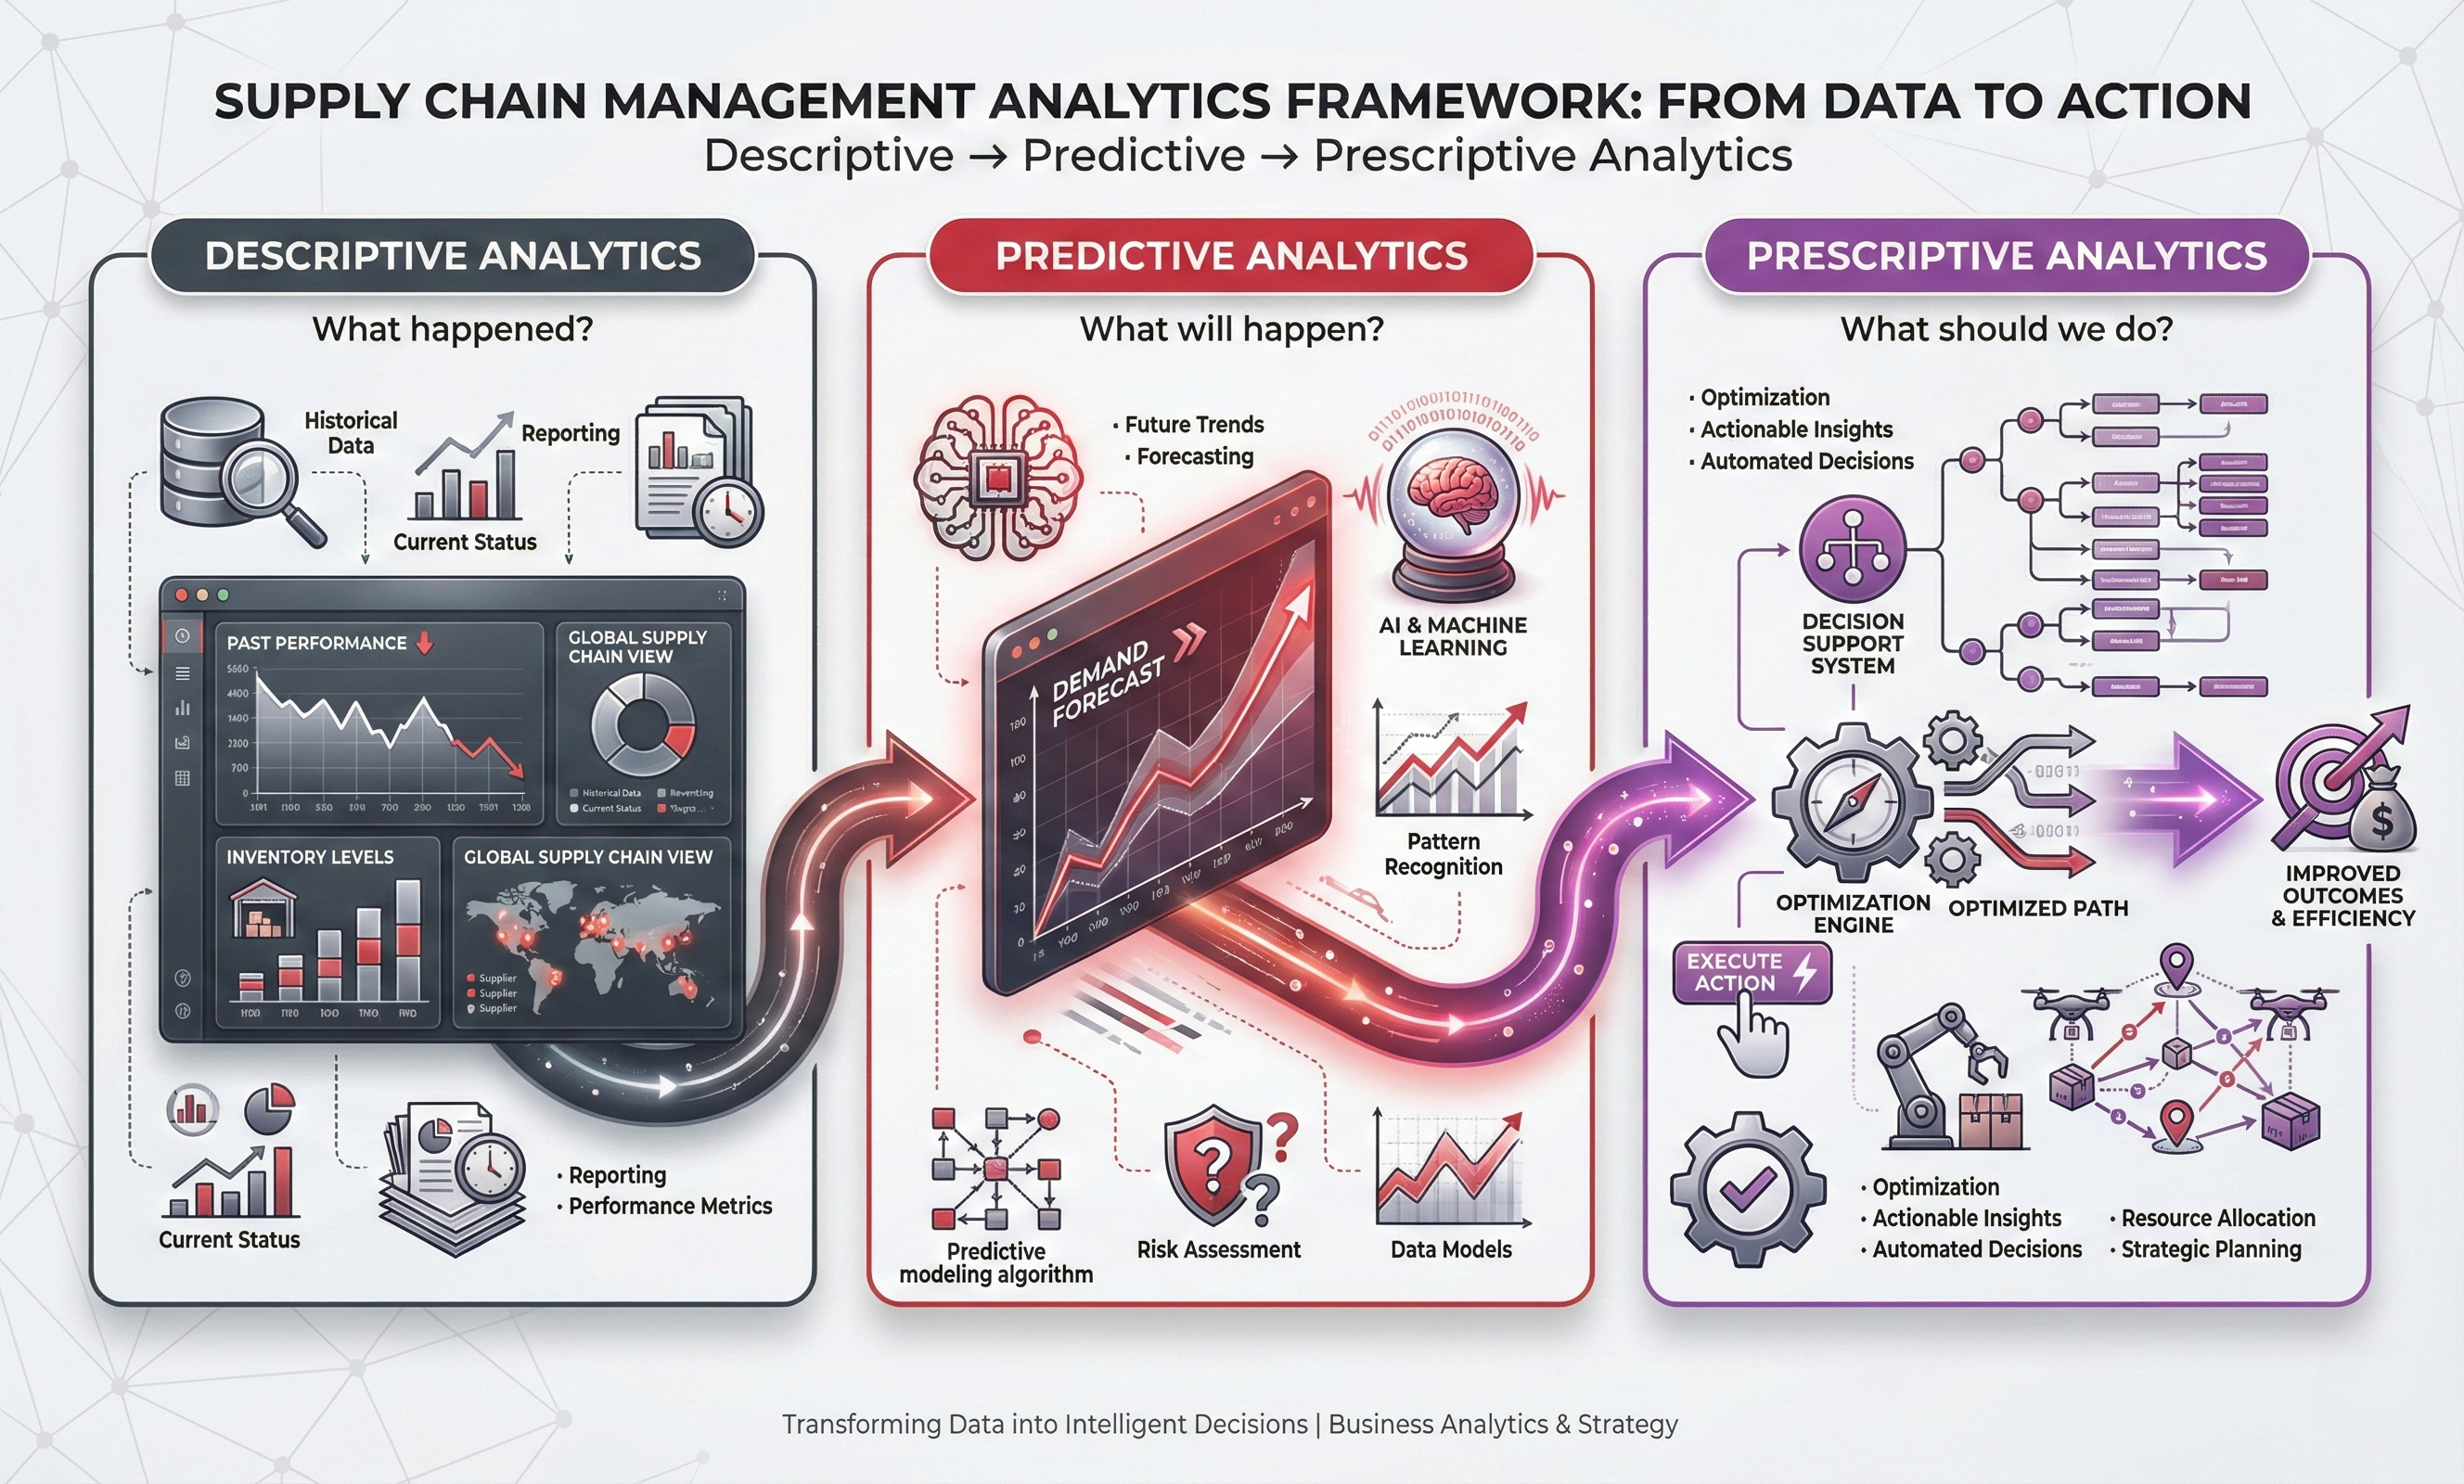 The three-stage analytics framework that drives modern supply chain decision-making
Retail platforms run this loop at enormous scale. Brand suppliers run the same loop with different constraints and partial visibility. In the new normal, competitive advantage often comes from how fast and how coherently that loop operates—and whether both sides can interpret shared signals in compatible ways.
The Supply Chain as a Conversation Between Models
The modern e-commerce supply chain isn’t defined by a single innovation. It’s defined by alignment: retailers and brand suppliers both evolved toward data-driven decision-making, but along different paths shaped by their incentives and constraints.
Retail platforms built predictive systems to understand demand, then prescriptive engines to convert demand into optimal ordering actions. Brand suppliers built forecasting stacks to interpret demand signals, then optimization and simulation layers to manage upstream risk, capacity, and working capital.
This isn’t a story of one side being “right” and the other “wrong.” It’s a story of a new operating reality: forecasts are signals, orders are decisions, and analytics is the bridge between them.
The companies that thrive will treat uncertainty as measurable, collaboration as a system, and planning as a continuous loop—not a monthly ritual.
The most important mindset shift is simple. Instead of asking whether a forecast was correct, we ask a better question—one that reflects the new normal:
Given uncertainty, what decision makes the supply chain more resilient, more efficient, and more trustworthy?